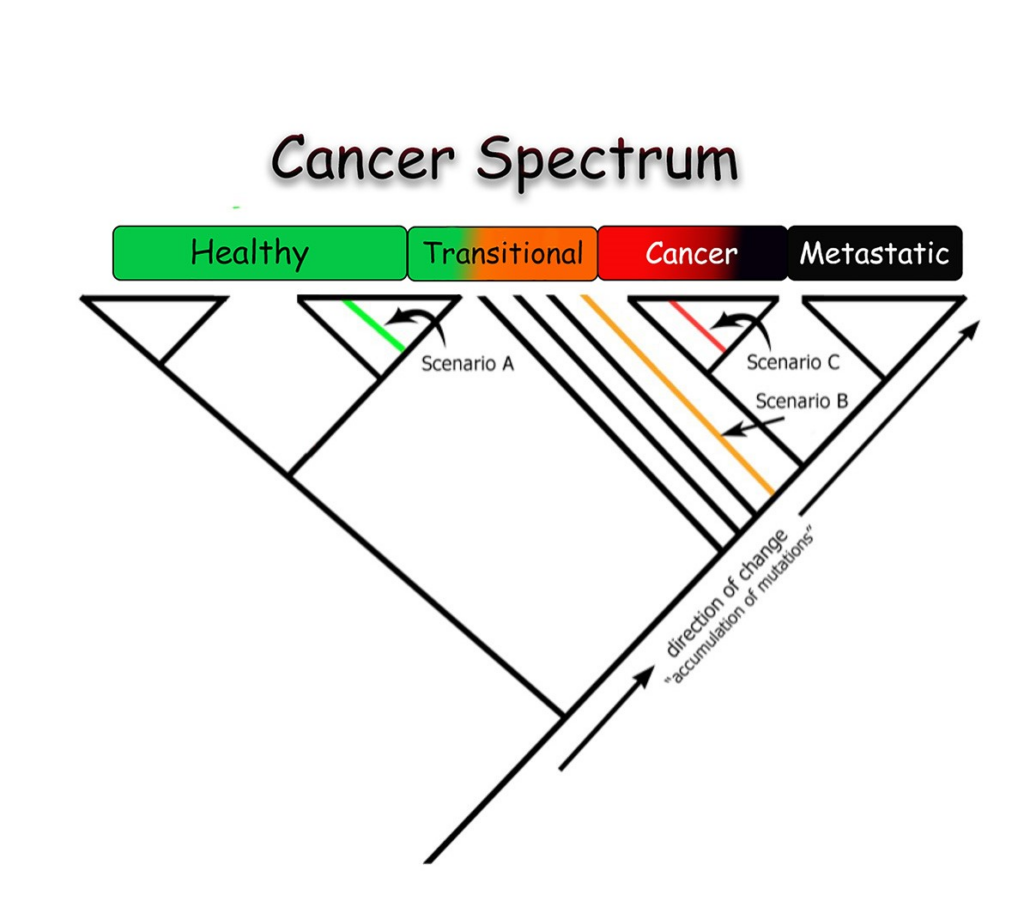
The cancer spectrum is a continuum that begins with the initiation phase (or as we like to call transition phase) that brings the cells to a primary tumor phase (red), and the last phase is the metastasis (black). The cladogram below the cancer spectrum is a construct from real data that shows that the cancer data can be modeled to match the cancer spectrum. Thus, identifying specimens with early changes (the transitional specimens) for early detection of cancer, and diagnosing primary and metastatic tumors.
