The Problem
Cancer is one of the deadliest diseases of our time — yet we are still fighting it with outdated tools. Despite decades of research and billions in funding, there is still no accurate, non-invasive method for detecting cancer early.
Why? Because cancer isn’t one disease — it’s many. It evolves differently in every patient, making it incredibly difficult to pin down reliable biomarkers. As a result, early detection often feels like searching for a moving target in the dark.
The current standard — invasive biopsies — means waiting until there’s already a visible lump or symptoms, often when it’s too late. By then, cancer has already spread, reducing survival rates and narrowing treatment options.
We’re not just behind — we’re risking lives by staying there. It’s time for a breakthrough.
The Solution
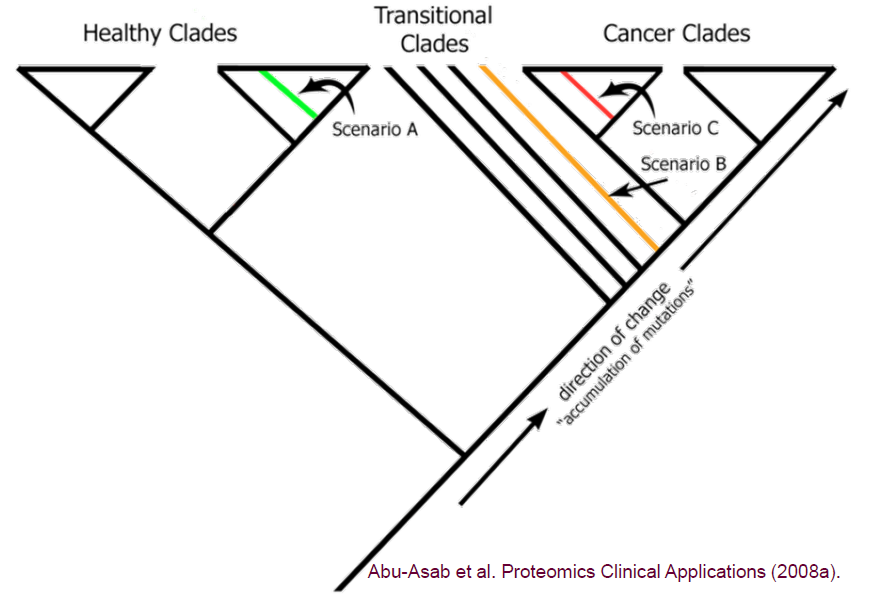
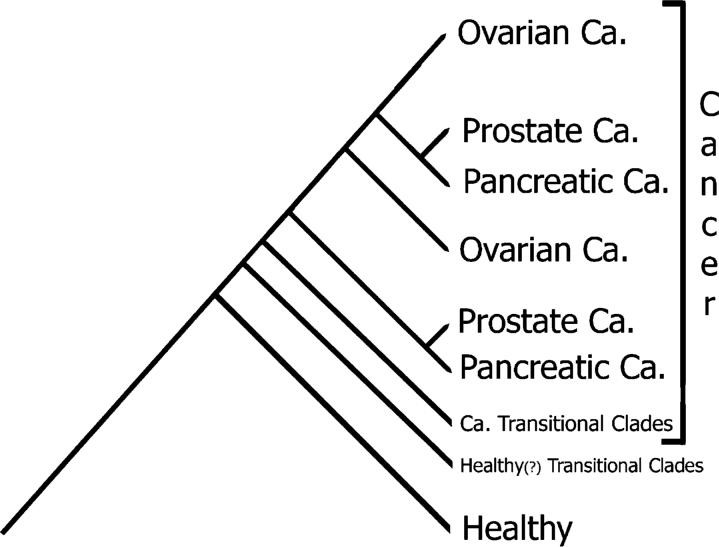
We apply phylogenetics—a well-established and proven method in fields like Botany and Zoology—to analyze cancer data. This evolutionary approach effectively accounts for the heterogeneity of cancer, offering biologically meaningful classifications that group patients based on their genetic similarities. Our platform leverages these principles to uncover critical insights into cancer, such as susceptibility to development, accurate diagnosis and typing, staging of cancer, and post-treatment evaluation.
We’ve developed a patented software solution that transforms cancer data to identify key biological markers. This includes detecting under- or overexpressed genes, and in the case of serum data, identifying novel or disappeared mass spectrometry peaks, as well as peaks indicative of up- or down-regulated proteins. The transformation process preserves the integrity of the data, ensuring that all biologically relevant information remains intact without reducing data size.
In addition to our patented algorithm, we have dedicated years to creating two processes for the universal diagnosis of cancer, enabling the earliest possible detection of the disease. Our method is versatile, applicable to all cancer types, and provides early detection that can save both lives and resources. Unlike traditional methods that rely on specific biomarker panels, our approach is sensitive to all cancer types, focusing on the full range of biological markers found in the serum. This enables us to monitor disease progression and tailor treatments, whether for primary or metastatic cancer.
Our method is the fastest, most cost-effective, and accurate solution for cancer detection and diagnosis, offering unparalleled precision in early-stage identification and treatment planning.
Clinical Study
As part of our ongoing research and development efforts, we have applied our innovative method to multiple datasets, leading to the publication of over a dozen papers in prestigious, peer-reviewed journals.
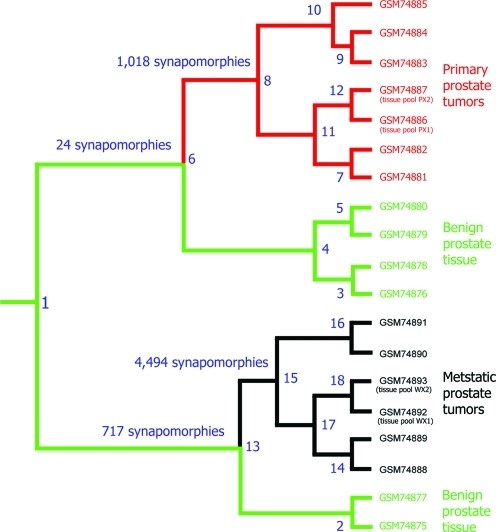
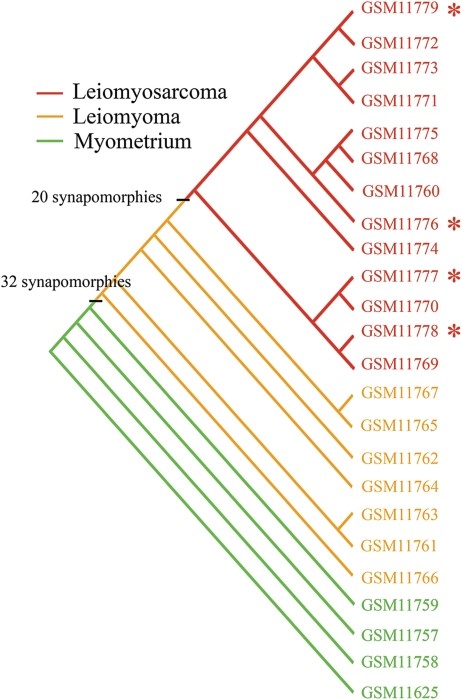
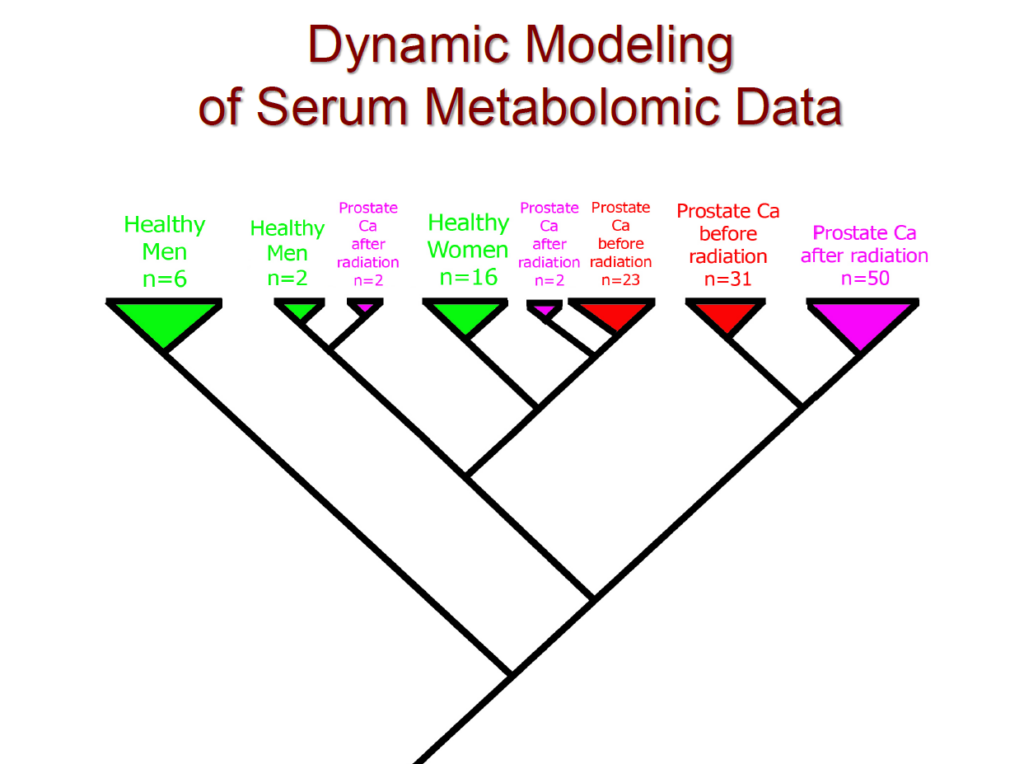
In addition, we recently conducted a comprehensive clinical study focused on prostate cancer. In this study, we analyzed data from 78 patients, including 16 healthy women, 8 healthy men, and 54 prostate cancer patients—both before and after radiation therapy. The cladogram below illustrates the evolutionary relationships between these patients, visually depicting their clustering patterns. Notably, our method achieved a 100% separation between healthy and cancerous patients. Furthermore, using only serum samples, we successfully distinguished between women and men.
Operations
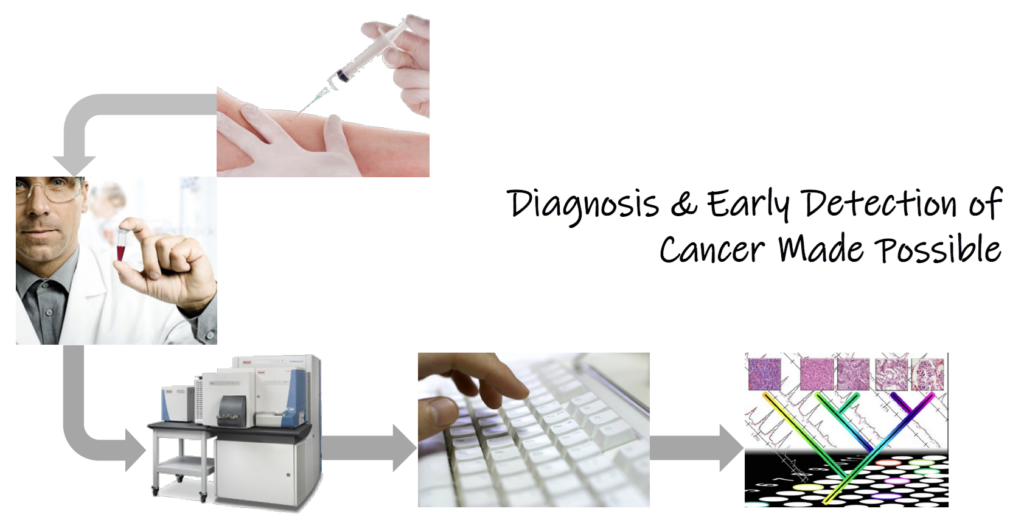
- Patients visit their doctors (typically as part of their annual check-up), hospitals, or labs, where they provide a blood sample. The sample is then processed using mass spectrometry proteomics or metabolomics to measure the molecules present. The lab analysis typically costs around $100.
- Once the analysis is complete, the patient, hospital staff, doctors, or lab personnel upload the measurement data (typically in an Excel file containing serum-related numbers) to our website from anywhere in the world.
- We then process these measurements using our proprietary algorithm and validated methods to provide accurate diagnoses and enable early detection of potential health issues.
Inside Look at Our Method
This software solution harnesses the extensive network of Metabolomics labs, both nationally and internationally. Launching this service requires only a minimal cost—just a unique identifier tied to each patient’s Metabolomics measurements or profile. We process these measurements in conjunction with our established baseline for each cancer type. Here’s how it works:
We will create a master cladogram for each cancer type, which will include data from 500 to 1,000 healthy individuals and a comparable number of cancer patients. This large dataset establishes a baseline that captures the variations present within the general population.
For example, for prostate cancer, we will process metabolomics data from 2,000 men of diverse demographics using our algorithm.
When a new, unknown specimen is submitted, it will be compared to this comprehensive database, and we will reprocess the data accordingly. Based on where the new specimen falls within the cladogram, there are three potential outcomes: healthy, transitional, or cancerous.
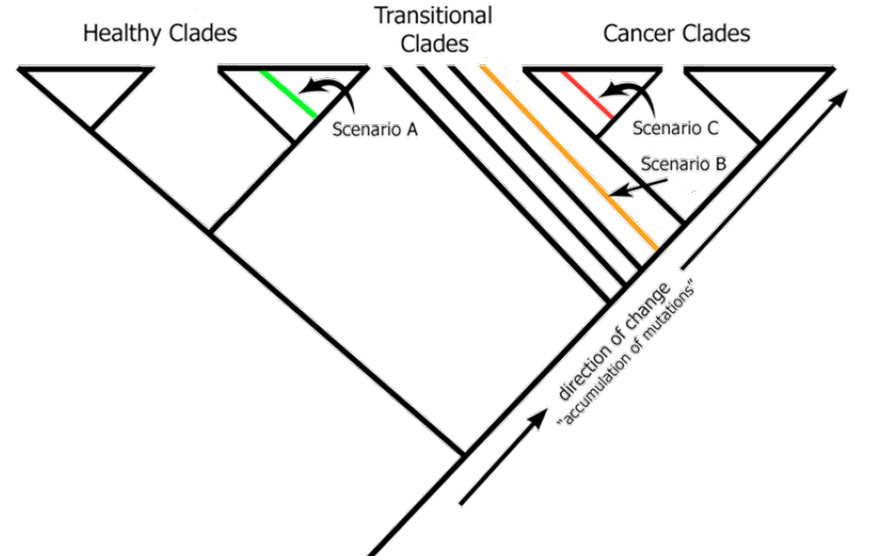
This approach allows us to diagnose and achieve early detection effectively.
Moreover, we can analyze the measurements from a single drop of a patient’s serum against the data from each population in the corresponding cladogram for every cancer type. The result is a non-invasive, comprehensive cancer screening with just one lab visit. This is the unique, compounded benefit we offer to our customers from the start.
Business Paths Forward
At this juncture, we see two paths forward:
1. FDA Approval
To advance towards FDA approval for cancer screening for a single cancer type, we need to raise $1M. This funding will cover the following:
| $100K for legal and application fees. |
| $200K to $500K to conduct a new clinical study to meet FDA requirements. |
| $200K for creating the master cladogram. |
| $200K to develop a minimal viable, cloud-native website for diagnostic use in the first year. |
FDA approval will not only allow us to offer the screening, but also enable insurance companies to cover the cost and doctors to prescribe it to patients.
Our pricing model will be $250 per screening, which includes a $100 lab analysis to produce mass spectrometry proteomics or metabolomics data.
After successfully launching and gaining adoption for the first cancer screening, we will replicate this process for additional cancer types, with the goal of eventually screening for the most common types of cancer.
2. Market Approach
Scenario A:
To create screenings for the five most common cancer types, we need to raise $2M. This budget will be allocated as follows:
| $1M for the development of 5 master cladograms:
$200K per cladogram, which covers 2,000 patients for each cancer type. |
| $200K to create a minimal viable, cloud-native website for the first year. |
| $800K to fund sales and marketing efforts in the first year. |
We will offer cancer screening for individual types at $250 per screening, which includes the $100 lab analysis for mass spectrometry proteomics or metabolomics data. Additionally, we will offer a bundled price of $350 for screenings across all 5 cancer types.
Scenario B:
To expand our offerings to the 10 most common cancer types, we need to raise $5M. The breakdown is as follows:
| $2M for the development of 5 master cladograms:
$200K per cladogram, covering 2,000 patients for each cancer type. |
| $500K for the creation of a minimal viable, cloud-native website for the first year. |
| $2.5MK for office rental, along with hiring two cloud engineers and four sales and marketing representatives for the first year. |
We will charge $250 per screening for each cancer type, which includes $100 lab analysis. For screenings across all 10 cancer types, the price will be $450 per screening, again including the $100 lab analysis.
Target Markets
Once we achieve the ability to diagnose and provide early cancer detection, we will focus on the following key markets:
- Hospitals: Offering incentives for them to conduct cancer screenings via our platform
- Laboratories: Partnering with labs specializing in blood analysis, encouraging them to provide cancer screening through our website
- Insurance Companies: Providing incentives for insurers to offer these screenings at no cost to their customers, saving substantial long-term costs through early detection
- Consumers: Targeting individuals directly who are proactive about monitoring their health, offering incentives to use our services
We will begin with the U.S. market, with plans to expand globally once our model is proven.